Household Income Percentiles in 2026: Where Does Your Income Rank?
- What household income percentiles actually mean
- 2026 US household income percentile table — full breakdown
- What each income tier looks like in real life
- How location changes everything
- Median vs mean — why the average lies to you
- How to move up the income ladder
- What the top 1% actually earns
You've probably wondered at some point — am I earning more or less than most Americans? Maybe you just got a raise and want to know if it actually moved the needle. Maybe you're trying to figure out if your salary is competitive. Or maybe you're just curious where you land on the spectrum.
Either way, household income percentiles give you the clearest, most honest answer. Not what people claim they earn at dinner parties. Not inflated averages pulled up by billionaires. Real numbers, ranked by where actual American households fall in 2026.
Let's get into it.
What Is a Household Income Percentile?
A percentile tells you what percentage of households earn less than you. So if you're in the 60th percentile, it means 60% of American households earn less than your household does — and 40% earn more.
This is different from your individual income. Household income includes all earners living under the same roof — a couple where both partners work, for example, would combine both salaries into one household income figure.
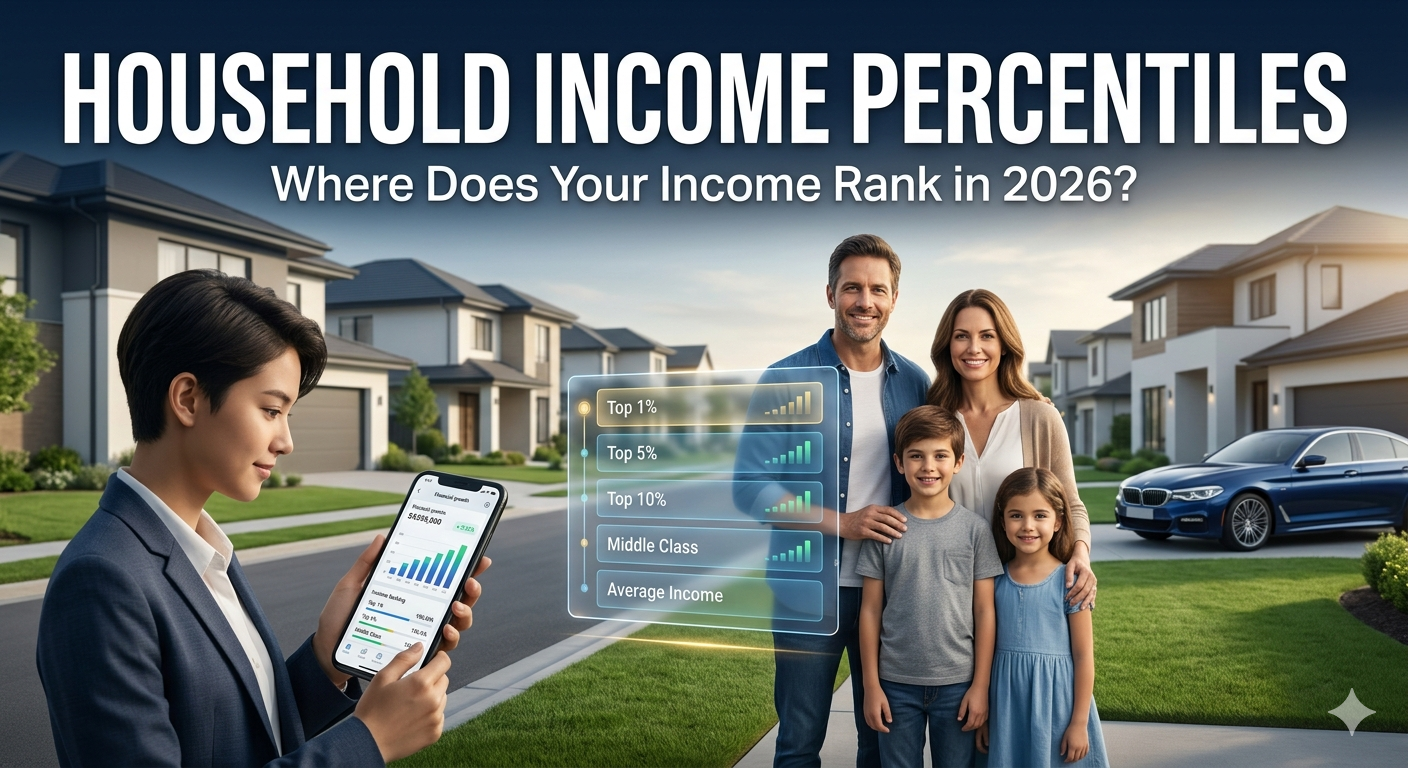
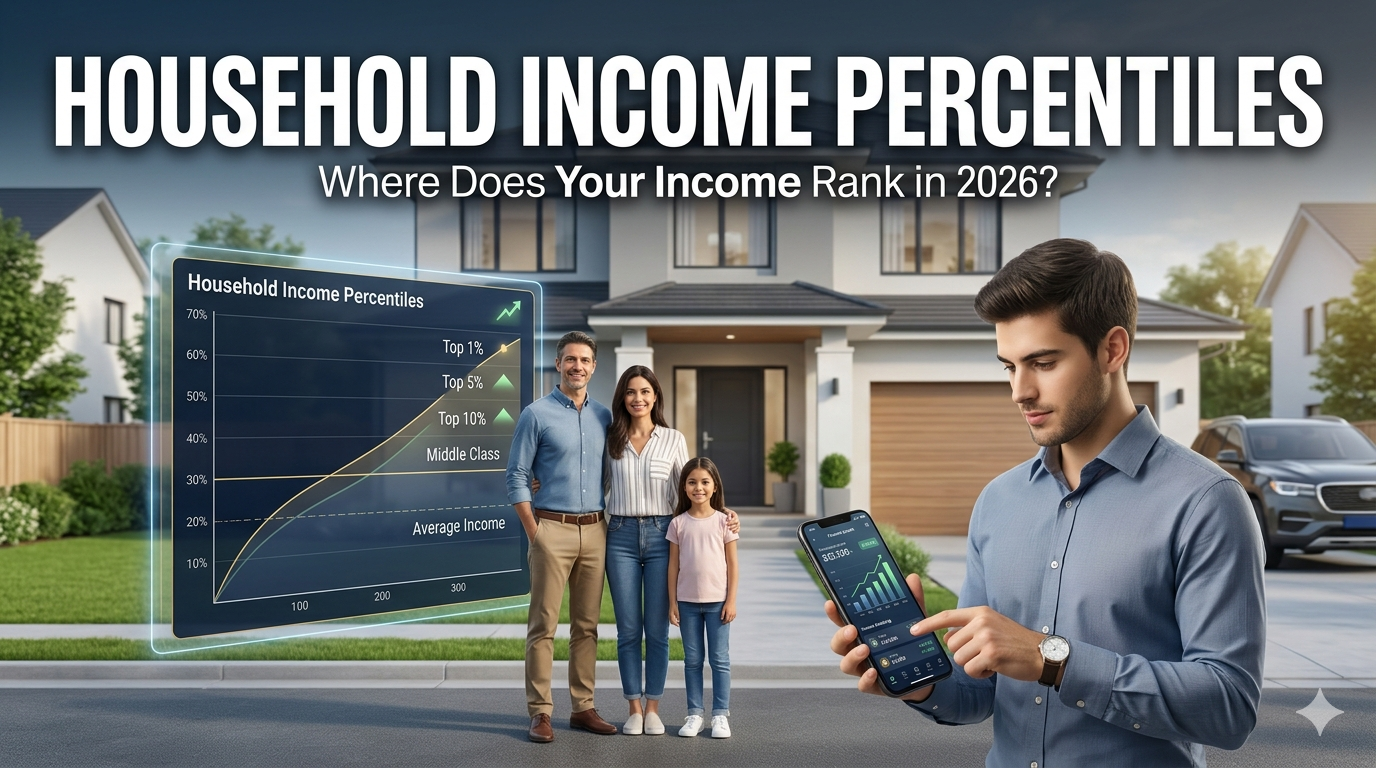
2026 US Household Income Percentiles — Full Table
Here is where American households actually stand in 2026. Find your household income in the left column and see exactly where you rank.
| Percentile | Annual Income | Monthly Income | Tier |
|---|---|---|---|
| 10th | $15,200 | $1,267 | Bottom 10% |
| 20th | $26,800 | $2,233 | Lower Income |
| 25th | $33,500 | $2,792 | Lower Income |
| 30th | $40,100 | $3,342 | Lower Middle |
| 40th | $52,400 | $4,367 | Lower Middle |
| 50th | $65,800 | $5,483 | Middle Class |
| 60th | $82,300 | $6,858 | Middle Class |
| 70th | $104,500 | $8,708 | Upper Middle |
| 75th | $118,200 | $9,850 | Upper Middle |
| 80th | $137,600 | $11,467 | Upper Middle |
| 90th | $192,400 | $16,033 | High Income |
| 95th | $262,000 | $21,833 | High Income |
| 99th | $528,000 | $44,000 | Top 1% |
| 99.9th | $2,100,000+ | $175,000+ | Ultra Wealthy |
What Each Income Tier Actually Looks Like
Numbers on a table are one thing. Understanding what those numbers feel like in daily life is another. Here's what each tier actually means for most households in 2026.
Key Statistics at a Glance
How Location Changes Everything
One of the most important things the national percentile table doesn't tell you is that $65,800 feels completely different depending on where you live.
In rural Mississippi or West Virginia, a $65,800 household income puts you firmly in the comfortable middle class. You can own a home, drive decent cars, and save consistently. In San Francisco or Manhattan, that same income barely covers rent for a one-bedroom apartment.
This is why cost-of-living adjusted income is a more meaningful measure of financial wellbeing than raw salary alone.
| City | Median Household Income | Cost of Living Index | Feels Like |
|---|---|---|---|
| San Francisco, CA | $136,000 | Very High | $72,000 elsewhere |
| New York City, NY | $112,000 | Very High | $68,000 elsewhere |
| Austin, TX | $94,000 | High | $78,000 elsewhere |
| Chicago, IL | $87,000 | Moderate | $80,000 elsewhere |
| Phoenix, AZ | $78,000 | Moderate | $74,000 elsewhere |
| Memphis, TN | $54,000 | Low | $72,000 elsewhere |
| Jackson, MS | $48,000 | Very Low | $75,000 elsewhere |
Median vs Mean — Why the Average Lies to You
You'll often see the average American household income reported as significantly higher than the median — sometimes by $20,000 to $30,000 or more. This isn't a mistake. It's a statistical distortion caused by extreme wealth at the very top.
When a handful of households earn tens of millions per year, they pull the mathematical average upward dramatically — even though the typical American household earns nowhere near that amount. The median (the exact middle value) is always the more accurate reflection of what a typical household actually earns.
What the Top 1% Actually Earns — And How They Got There
To reach the top 1% of household income in the United States in 2026, your household needs to earn approximately $528,000 per year or more. The top 0.1% — the truly ultra-wealthy — typically earn over $2 million annually.
How do households get there? The breakdown might surprise you:
- Business ownership — the largest driver of top 1% income is owning a successful business, not a salary
- Investment income — dividends, capital gains and rental income compound over time into significant income streams
- Dual high-earning professionals — two doctors, two lawyers, two senior tech executives combining incomes
- Inherited wealth — a meaningful but often overstated contributor to top income percentiles
- Senior executive compensation — base salary plus stock options and bonuses at Fortune 500 companies
The key insight is that salary alone rarely gets anyone into the top 1%. Most top earners have multiple income streams — their primary career income is supplemented by business ownership, investments, or both.
How to Move Up the Income Percentile Ladder
Understanding where you are is step one. Actually moving up requires intentional strategy. Here's what the data consistently shows works:
Where Do You Go From Here?
Knowing your percentile is useful context — but context alone doesn't change anything. What matters is what you do with the information.
If you're below the median, the focus should be on increasing income before cutting expenses. There are only so many lattes you can stop buying. Adding even $500–$1,000 per month in side income moves you up significantly faster than extreme frugality alone.
If you're in the middle class, the priority is protecting and growing what you have. Building an emergency fund, eliminating high-interest debt, and starting to invest — even modestly — puts compound growth to work for you.
If you're in the top quartile, the game shifts entirely to wealth preservation, tax efficiency, and building passive income streams that eventually exceed your active income.